Car Ownership Cost Calculator
True cost of owning your car
Enter your car details to see the true cost of ownership
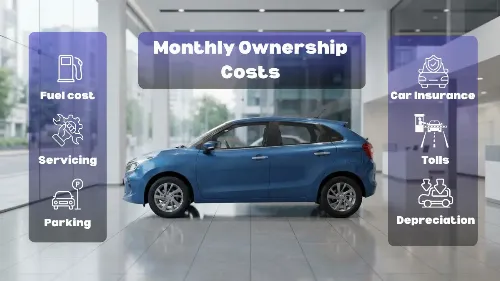
The EMI is only part of the story. This calculator adds fuel, insurance, maintenance, and depreciation to show what your car really costs you — per year, per month, and per kilometre.
Ask anyone what their car costs them and they will quote their EMI. ₹12,000 a month, done. But the EMI is rarely even half the real picture. Insurance, fuel, servicing, tyres, and the part almost nobody factors in is depreciation, all quietly add up every single year. A car ownership cost calculator exists to put all of that in one place, so you can see what a car actually costs you to keep, not just what it costs to finance.
This car running cost calculator takes your car's price, loan details, fuel type and usage, and your annual insurance and maintenance figures, and combines them with a depreciation estimate to show the total cost of ownership car India drivers actually experience. The output is simple: total cost over your chosen ownership period, broken into a monthly average and a per-kilometre figure plus a year-by-year table showing exactly how your car's value drops while your costs add up. The goal of this tool is to answer one question honestly: what does the real cost of owning a car actually look like, in rupees, month by month?
How This Car Ownership Cost Calculator Works
A car ownership cost calculator with EMI and fuel needs to combine two very different kinds of costs: fixed costs that arrive every month or year regardless of how much you drive, and variable costs that scale with your usage. This calculator separates the two clearly, then adds them together for the full picture.
Car EMI plus running cost is the foundation. The EMI is calculated using the standard reducing-balance loan formula on your loan amount (car price minus down payment), at your chosen interest rate and tenure. Fuel cost is calculated from your monthly distance divided by mileage, multiplied by fuel price. Insurance and maintenance are entered as annual figures and converted to a monthly average. Finally, depreciation is applied to the car's value each year at your chosen rate, reducing the resale value while being tracked as a cost you've "spent" even though no cash left your account for it.
      Total Cost = Down Payment + Σ(EMI + Fuel + Insurance + Maintenance) for each year

      Resale Value (Year Y) = Car Price × (1 − Depreciation Rate)^Y
- EMI = calculated on loan amount using reducing balance formula, paid only during loan tenure
- Fuel = (Monthly km ÷ Mileage) × Fuel Price × 12, repeated each year
- Insurance + Maintenance = entered as fixed annual amounts
- Depreciation = applied annually on the car's reducing value, not on the original price
- Cost per km = Total Cost ÷ Total Kilometres Driven over the ownership period
Note that depreciation is calculated on a reducing balance, not a flat percentage of the original price. A car worth ₹9 Lakh depreciating at 12% loses ₹1.08 Lakh in Year 1 (bringing it to ₹7.92 Lakh), then loses 12% of ₹7.92 Lakh which is about ₹95,000 in a Year 2. This is how real resale values behave: the rupee amount of depreciation shrinks each year even though the percentage stays the same.
Real Example: Total Cost of Owning a Car for 5 Years
The question how much does a car cost per month in India has no single answer as it depends heavily on the car's price, your loan terms, and how much you drive. Here is a worked example using the default values in this calculator: a ₹9 Lakh car, ₹1.5 Lakh down payment, 9% interest over 60 months, petrol at ₹104/L with 16 km/L mileage, 1,200 km/month, ₹18,000/year insurance, ₹12,000/year maintenance, and 12% annual depreciation.
Total Cost: ₹13.87 L | Per Month: ₹23,117 | Per KM: ₹19.27
- EMI (60 months): ₹15,572/month — runs for the full 5 years
- Fuel: 1,200 km ÷ 16 km/L × ₹104 = ₹7,800/month
- Insurance + Maintenance: ₹2,500/month combined
- Resale value after 5 years: ₹4.75 L (from ₹9 L original, at 12% reducing depreciation)
- Total depreciation over 5 years: ₹4.25 L — the single largest cost component
Notice that depreciation (₹4.25 L) is larger than the total fuel cost over 5 years (₹4.68 L) and roughly equal to the total interest paid on the loan. Most people who quote "my car costs ₹15,572/month", the EMI alone are underestimating their real monthly cost by roughly ₹7,500, or nearly 50%.
What This Calculator Shows — A Complete Ownership Cost Breakdown
Most online tools calculate either an EMI, or a fuel cost, or a depreciation estimate rarely all three together. This car ownership cost breakdown tool was built specifically to combine them, because the true cost of car ownership only becomes clear when you see EMI, fuel, insurance, maintenance, and depreciation sitting side by side, not scattered across four different calculators.
Monthly cost split across all four categories
The donut chart shows your average monthly spend split between EMI, fuel, insurance, and maintenance, the four costs that arrive every month or every year. Seeing them as proportions of one whole, rather than four separate numbers, makes it immediately clear where your money actually goes.
Cumulative cost vs resale value - visualised together
A line chart plots two things on the same axis: how much you've cumulatively spent on the car, and what the car is worth at that point. The widening gap between these two lines, year after year, is the visual representation of "sunk cost" and it is usually far larger than people expect.
Year-by-year table: resale value, depreciation, and cumulative cost
Every year of ownership gets its own row showing the car's resale value at that point, how much value it lost that year, the running cost for that year (EMI + fuel + insurance + maintenance), and the cumulative total cost since day one. This is the closest thing to a year-by-year bank statement for your car.
A single cost-per-km number for your entire ownership
Cost per km is calculated by dividing your total ownership cost, including depreciation by the total kilometres you drive over the period. This single number lets you compare owning a car against alternatives like cabs, autos, or public transport on a like-for-like basis, something an EMI figure alone can never do.
What this calculator assumes: A constant depreciation rate applied annually on the car's reducing value, constant fuel price and monthly distance throughout the ownership period, and EMI that stops once the loan tenure ends (even if ownership continues longer). It does not account for fuel price inflation, occasional large repairs, loan prepayments, or resale transaction costs (typically 2-5% of sale price). For fuel-type comparisons, use our Cost per KM Calculator. For EV vs Petrol lifetime comparisons, use our EV vs Petrol Calculator.
How to Use This Yearly Car Expense Calculator
The calculator needs nine inputs across three groups. Here is what each one means and what value to use.
Step 1: Car price and down payment
Enter the on-road price that is the amount you actually paid or will pay, including RTO registration and the first year's insurance, not just the ex-showroom price. The down payment is whatever cash you're putting in upfront. If you're paying entirely in cash with no loan, enter the full car price as the down payment and set the interest rate to 0.
Step 2: Loan interest rate, tenure, and ownership period
Enter your actual loan interest rate (typically 8-11% for new cars in India) and tenure in months. The ownership period is how long you plan to keep the car and this can be longer than the loan tenure. If you plan to keep a car for 7 years on a 5-year loan, the EMI stops after year 5 but depreciation and running costs continue for the full 7 years, and the calculator handles this automatically.
Step 3: Fuel type, price, mileage, and monthly distance
Select your fuel type petrol, diesel, CNG, or electric and the calculator adjusts the price and mileage units automatically (₹/L and km/L for petrol/diesel, ₹/kg and km/kg for CNG, ₹/kWh and km/kWh for EV). Use your real-world mileage, not the manufacturer's claimed figure, which is typically 10-20% higher than what you'll actually get. Monthly distance should be your honest average across all months, not just your best-case commute days.
Step 4: Insurance, maintenance, and depreciation rate
Insurance is your annual comprehensive premium, check your last renewal for the exact figure. Maintenance should include scheduled services, tyres (amortised - a ₹24,000 tyre set every 4 years is ₹6,000/year), and minor repairs; ₹10,000-15,000/year is typical for a mid-size petrol car. The depreciation rate is the trickiest input — see the depreciation guide below for realistic values by car segment and age. Once you have your results, use our Monthly Budget Calculator to check whether the monthly average cost fits comfortably within your overall monthly expenses, not just your loan EMI line item.
Car Depreciation Rate Guide for India - The Hidden Cost
A car depreciation calculator India drivers actually need has to start from a realistic depreciation rate, because this single input has the biggest impact on the total cost shown. The hidden cost of owning a car in India is almost always depreciation as it doesn't show up on a bank statement, doesn't get a receipt, and yet quietly erases more value than fuel or maintenance for most owners.
The car depreciation rate per year in India isn't a single number. It varies by brand reliability, fuel type, segment, and how the depreciation curve bends over time as new cars lose value faster in the first 2-3 years than they do later. The table below gives realistic starting points; this is essentially a car resale value calculator depreciation reference you can use to pick the right rate for your specific car.
| Car Segment / Brand Type | Year 1-3 Depreciation | Year 4+ Depreciation | Suggested Rate for This Calculator |
|---|---|---|---|
| Maruti, Toyota, Honda (strong resale) | 10-12% p.a. | 8-10% p.a. | 10% |
| Hyundai, Kia, Tata (average resale) | 13-15% p.a. | 10-12% p.a. | 12% |
| Premium / Luxury (BMW, Audi, Mercedes) | 18-22% p.a. | 12-15% p.a. | 18% |
| Electric Vehicles (battery uncertainty) | 15-20% p.a. | 10-12% p.a. | 15% |
| Diesel cars (5+ years, city restrictions) | 13-16% p.a. | 15-18% p.a. (steepens) | 14% |
Car depreciation at 12% per year is the default in this calculator because it represents a realistic blended average for mass-market petrol cars in India over a 5-year period. The reducing-balance method means the rupee impact is front-loaded: a ₹10 Lakh car at 12% loses ₹1.2 Lakh in Year 1 but only about ₹70,000 in Year 5, because each year's depreciation is calculated on an already-reduced value. If your car is a popular model with strong resale demand (certain Maruti and Toyota models), you may be justified in using 9-10% instead of 12%, which can change your total cost estimate by ₹50,000-80,000 over 5 years.
Cost Per KM of Owning a Car — Why It Changes With Usage
A cost per km car calculator output is one of the most misunderstood numbers in personal finance. The cost per km of owning a car in India isn't fixed as it depends heavily on how much you drive, because fixed costs (EMI, insurance, depreciation) get divided across however many kilometres you actually put on the odometer. The table below shows how dramatically car cost per km in India changes for the same ₹9 Lakh car at different usage levels, all other inputs held constant.
| Monthly Distance | Annual KM | Total Cost (5 yrs) | Cost per KM |
|---|---|---|---|
| 500 km/month | 6,000 km | ₹12.40 L | ₹41.33/km |
| 1,200 km/month | 14,400 km | ₹13.87 L | ₹19.27/km |
| 2,000 km/month | 24,000 km | ₹15.58 L | ₹12.98/km |
| 3,000 km/month | 36,000 km | ₹17.73 L | ₹9.85/km |
This is the key insight for anyone evaluating a low mileage car cost per km question: at 500 km/month, your car costs over four times as much per kilometre as it would at 3,000 km/month, not because fuel got more expensive, but because the same fixed costs (EMI, insurance, depreciation) are spread across far fewer kilometres. If you're driving under 800-1,000 km/month, it's worth honestly comparing your total ownership cost against what the same travel would cost via cab or auto, our Cost per KM Calculator can help with that comparison across fuel types.
EMI vs Running Cost - Fixed vs Variable Costs Explained
Understanding EMI vs running cost car ownership requires separating costs into two buckets: fixed cost vs variable cost for a car. Fixed costs arrive whether you drive the car 0 km or 3,000 km that month — EMI, insurance, and depreciation fall into this category. Variable costs scale directly with usage — fuel is the main one, and a portion of maintenance (tyres, brake pads) also scales with distance.
EMI: Same every month for the loan tenure, regardless of kilometres driven.
Insurance: Fixed annual premium based on car value (IDV), not usage.
Depreciation: The car loses value over time even if it sits in the garage unused — age and market conditions drive this more than mileage for most cars.
Implication: if you barely drive your car, these costs still hit you in full — making your effective cost per km very high at low usage.
Fuel: Directly proportional to kilometres driven - zero km means zero fuel cost.
Maintenance (partial): Tyres, brake pads, and oil changes are mileage-linked, though annual servicing has a fixed component too.
Implication: driving more doesn't proportionally increase your total cost as much as you'd think, because fixed costs don't grow, this is why cost per km drops as usage increases.
Car insurance and maintenance cost in India together typically run ₹25,000-35,000/year for a mid-size petrol car, roughly ₹2,000-3,000/month. This is dwarfed by EMI and depreciation for most owners in the first 5 years, which is why this calculator groups insurance and maintenance together in the monthly breakdown rather than giving them undue prominence.
Frequently Asked Questions